What’s new?
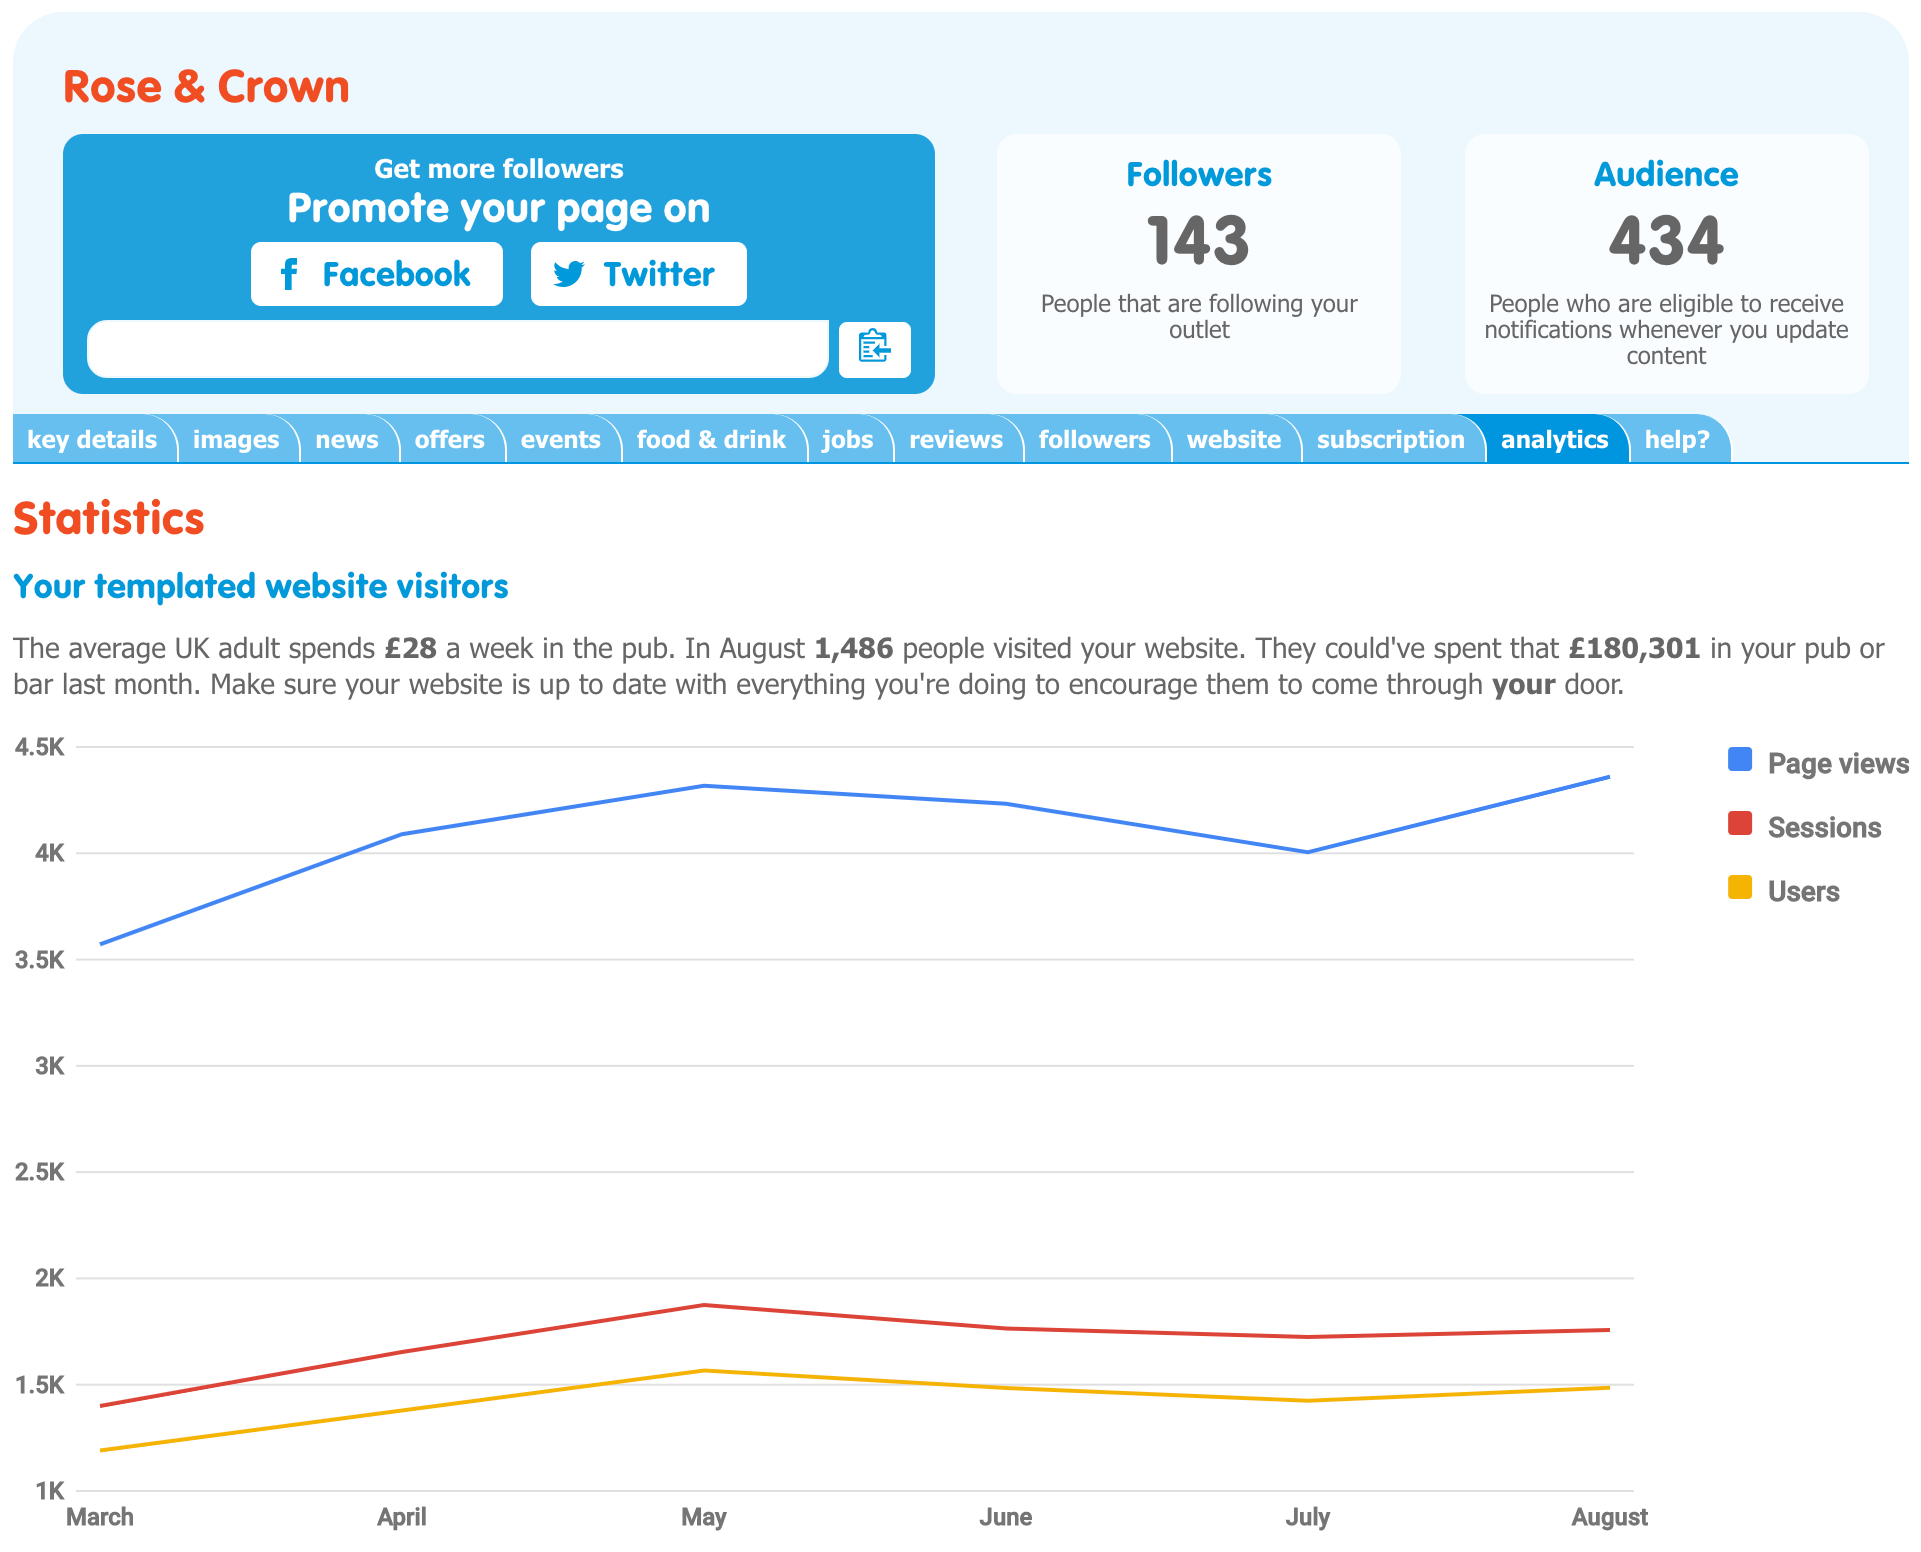
We have added a new analytics tab to your pub’s Useyourlocal page that gives you a visual representation of the user activity on your templated website. These statistics have been generated by Google Analytics and will help you get an idea of the traffic that your website is receiving each month.
What does it mean?
On your analytics chart you will see 3 different measurements of activity, these are; page views, sessions, and users. They each represent the number of times a certain action has been logged on your website. Below is an explanation of what each of them means.
Users: This is the number of individuals who have visited your website, meaning regardless of how many times an individual visits your website they will only ever register as one person. This number will always be the lowest on the chart because it is the base statistic from which the others are calculated.
Sessions: This represents the number of times an individual user has visited your website. So, while they are considered one user (see above), should they visit your website on two separate occasions that will account for two sessions. Continually updating your website with all your current news, offers and events increases the likelihood that your users will take the time to visit it more often.
Page views: Every time a page on your website is viewed it is registered here. So, if one user looks at both your drinks page followed by your events page, this will account for two page views. Ideally, the gap between the number of users and the number of page views should always be quite large because it means those who visit your website are taking the time to look at everything you have to offer. A good way to build your page views is to make sure you are posting engaging and up-to-date content across your whole website.
Why is it useful?
These analytics allow you to see exactly how many people are looking at your pub online each month. As well as showing you exactly how your website is benefiting your business, these statistics also offer some insight into how consumers are responding to your content. Maybe certain events or offers have increased traffic, or there is a particular time of year that drives peoples’ interest in your pub or bar. All this information gives you even more tools for planning activities and maximising the exposure your website gives them. The more eyes you’ve got on your website, the more feet you’ll get through your door.
How often is it updated?
The analytics will update automatically at the end of each month with figures dating back up to 6 months, depending how long your website with us has been active.
What can i do to increase my website traffic?
The key to attracting people to your website is keeping it fresh and up-to-date. The more often you are adding your news, offers and events, the more often people are going to be checking back to see what’s going on. Your website is like your shop window, you need to make it as inviting as possible, because people will only be interested if there is something to be interested in. It’s also important that you spread the word, share it on your social media, put posters up behind the bar, you could even put a good old-fashioned ad in the local newspaper! Remember, the average person spends £28 a week in the pub, make sure that pub is yours.